Ixsight is looking for passionate individuals to join our team. Learn more


Ixsight is looking for passionate individuals to join our team. Learn more
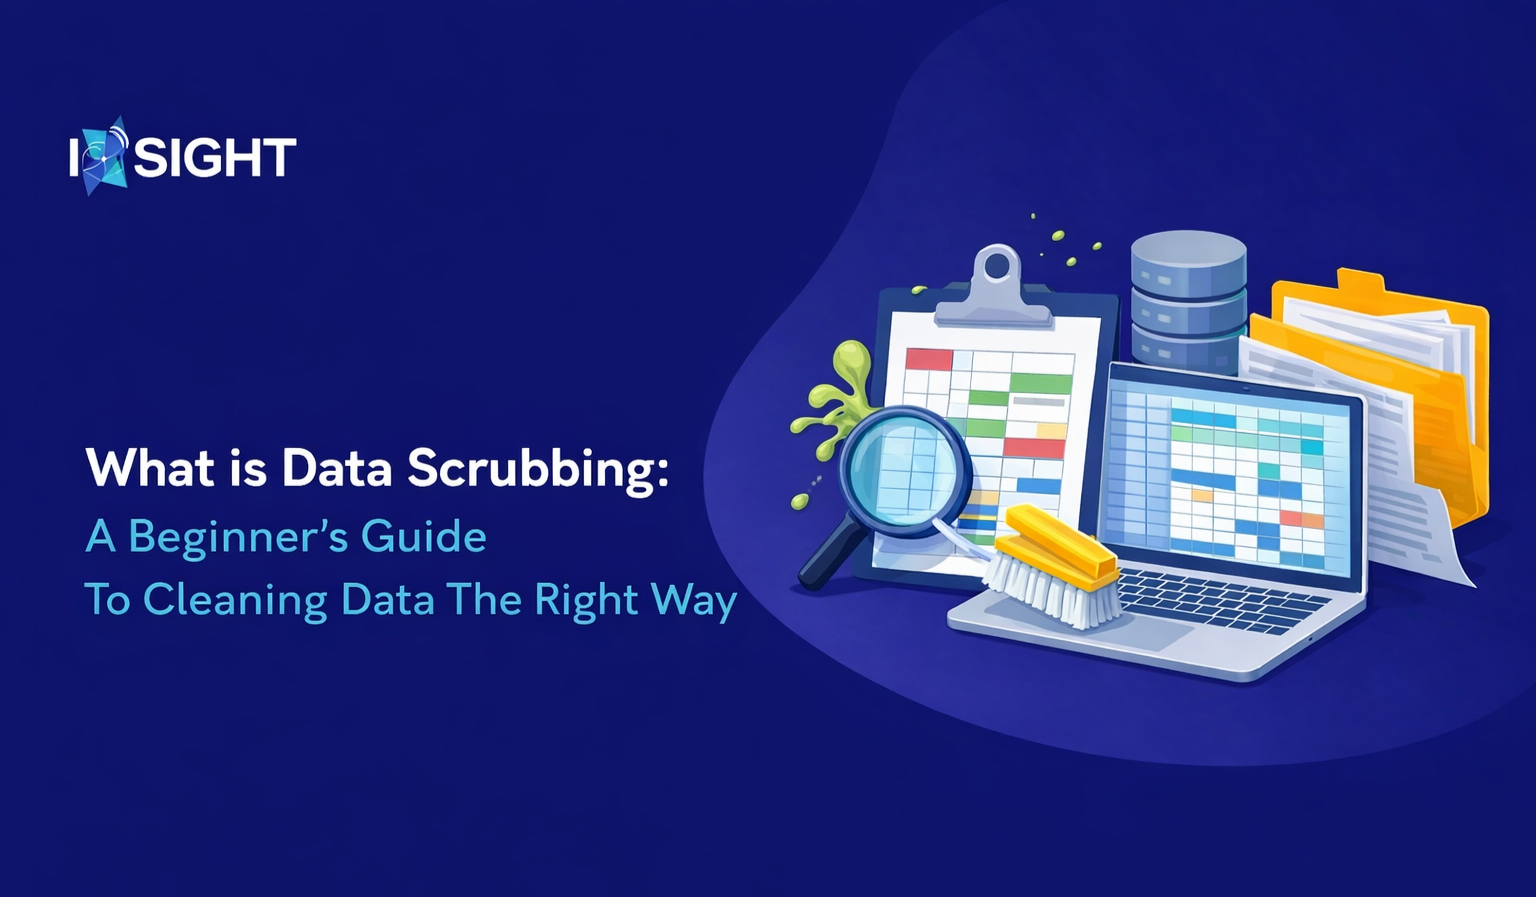
In the modern-day data-driven society, it is important that one becomes familiar with what data scrubbing entails when dealing with information. Data scrubbing is the cleansing process of detecting and repairing (or deleting) corrupted or inaccurate records of a dataset, also called data cleansing. The definition of data scrubbing entails determining the errors, such as duplicates, inconsistencies, missing data, and outdated data, to make sure that the data is accurate and reliable. Likewise, the definition of data cleansing focuses on enhancing the quality of data by correcting structural faults, standardizing data formats, and verifying entries.
A lot of professionals seek what is data cleansing since bad data quality may result in erroneous analytics and poor decisions. Data scrubbing is significant in the pre-processing of raw data before analysis, machine learning, or reporting. Modern technologies such as Data Cleaning Software and Data Scrubbing Software have become essential in order to simplify this process. This makes these platforms automate the tedious jobs and saves time, and minimizes human error. We will discuss all you need to know about cleaning data in the right way in this beginner's guide of a beginner.
It is important to learn the reasons why it is necessary to dive deeper into data scrubbing. The data may be gathered in a variety of different ways, such as databases, spreadsheets, APIs, user inputs, or sensors. This diversity brings on board mistakes. Research indicates that poor data costs companies billions every year in terms of poor decisions.
Common issues include:
Outliers (extreme values that distort the results) are usually detected and eliminated or changed.
Malformed records (e.g., negative age or incorrect email format)
These issues continue to exist without adequate data cleaning that would result in misleading insights. In marketing, e.g., duplication of customer records may create redundancy in the campaigns, wasting resources. Patient data that is inaccurate may be life-threatening in the medical field.

Data scrubbing refers to the methodical process of cleaning data with the aim of improving its quality. In the majority of cases, it is synonymous with data cleansing. It is aimed at converting dirty data to clean data that can be used.
Data scrubbing definition could be divided into steps:
What data cleansing is slightly different in focus- some scholars consider cleansing as a matter concerned with correctness (accuracy and completeness), whereas scrubbing may involve enrichment (addition of missing data). But practically, they are very much overlapping.
Data scrubbing is not a new concept, as the idea of computing with large amounts of data has been in use since the early days of computers. ETL (Extract, Transform, Load) tools had been developed in the 1990s, and manual cleaning was widespread before that.
In the 2010s, the popularity of automated Data Scrubbing Software increased with the emergence of big data. Software such as Talend, Informatica, and open-source software such as OpenRefine transformed the industry. Currently, Data Cleaning Software, which is powered by AI, identifies anomalies with smart machine learning.
The most common problems to be aware of when cleaning data the right way are:
Lack of Complete Data: Missing values are a common issue with 20-30% of the datasets on average.
These can be solved by data scrubbing and thereby make the data reliable.
A simple step-by-step instruction on how to scrub data is as follows:
The first and most important thing in every data scrubbing is to have a comprehensive data profiling to know well what you have. Data profiling is not a cursory look; it is a methodical analysis that establishes the foundation of all further cleaning efforts. In the absence of this step, there is a possibility of blindly applying fixes that could increase the problems or bring additional biases.
The first thing that you will do is to load your dataset and create important descriptive statistics. Divide the total number of rows and columns in order to understand the size. The number of unique values per column in a table- this can show the number of potential categorical variables or concealed duplicates. Calculate the amount of missing or null entries and the percentage, since this will require special processing. In numeric columns, determine minimum, maximum, mean, median, and standard deviation in order to identify unrealistic numbers at an early stage.
Quick profiling is available in built-in functionality with tools such as Microsoft Excel or Google Sheets. Column Auto Filters can be used to sort and visualize blanks or inconsistencies. Indifferent of us using the uniqueness of items, pivot tables shall be created to summarize counts, averages, and unique things by their dimensions. Count Count COUNTIF Use formulas such as COUNTIF COUNTIF counts duplicates Count Average AVERAGEIFS Count conditional Statistics AVERAGEIFS Conditional formatting is able to point out the nulls in red colour or the extremes in yellow colour, and patterns stand out.
To better control it programmatically, the pandas library of Python is invaluable to neophytes who are starting to code. Once your file (e.g., CSV, Excel) has been imported, run:
Python
import pandas as pd
df = pd.read_csv('your_dataset.csv') # Or pd.read_excel for spreadsheets
print(df.info()) # Displays column names, data types, non-null counts, and memory usage
print(df.describe(include='all')) # Includes stats for numeric and categorical; 'all' covers both
print(df.head(10)) # Preview top rows for visual inspection
print(df.nunique()) # Unique counts per column
A particularly informative output is the df.info(), which indicates whether the columns are of the wrong type (e.g., a date as a string). Df.describe indicates outliers using min/max extremes. profiling Additional profiling: df =df.valuecounts(column): to display common values or misspellings. This action usually reveals 80 percent of the problems at the beginning of the process, preventing time wastage in the future. This is where you should always devote 20-30 percent of your cleaning time; it is an investment that will be paid back exponentially.
Losses of values in data are common in real-life data due to entry errors, system failures, or no response in surveys. Ignoring them may bias the statistical models, derive reduced predictive power, and draw invalid inferences. An example is that averaging a column having a large number of missings underestimates variability.
Assess the level of first: when a column has more than 50-70 per cent missing, then maybe drop it altogether. In the case of rows, where missing values are dispersed and impact less than 5-10 percent of the data, they can be safely deleted.
Deletion methods:
Imputation is preferable when data loss is undesirable. Simple statistical fills:
Code example:
Python
df['numeric_col'].fillna(df['numeric_col'].median(), inplace=True)
df['category_col'].fillna(df['category_col'].mode()[0], inplace=True)
Advanced approaches include predictive imputation. K-Nearest Neighbors (KNN) finds similar rows and averages their values:
Python
from sklearn.impute import KNNImputer
imputer = KNNImputer(n_neighbors=5)
df_imputed = pd.DataFrame(imputer.fit_transform(df.select_dtypes(include='number')))
Robust analysis uses multiple copies of the data (created using fancyimpute) filled in. Visualize missingness using libraries such as missingno to plot matrices or heatmaps to identify patterns (random vs. systematic). You never leave your choice unrecorded, as it influences the results downstream.
Duplicated records also waste storage, skew aggregations, and lead to the overrepresentation of models. They are usually a result of the merging of data, duplication, or scraping errors.
Delimit duplicates: it is easy to define a row with an exact match, but partial duplicates issues need key columns such as ID, email, or name+date.
In Excel: Select data, then Data > Remove duplicates, and select the columns.
In SQL databases:
SQL
SELECT key_columns, COUNT(*) FROM table GROUP BY key_columns HAVING COUNT(*) > 1; -- Identify
CREATE TABLE clean_table AS SELECT DISTINCT * FROM original_table; -- Or use ROW_NUMBER for keeping one
In pandas:
Python
duplicates_count = df.duplicated(subset=['email', 'phone']).sum()
df = df.drop_duplicates(subset=['email', 'phone'], keep='last') # Keep most recent
Data Cleaning Software like OpenRefine clusters similar entries for review. Sort by timestamp to retain the latest. Log removed count for transparency.
Inconsistencies in formatting prevent proper analysis, like dates in MM/DD vs. DD/MM, causing sort errors.
Text normalization:
Python
df['name'] = df['name'].str.lower().str.strip().str.title() # Proper case
Dates and times:
Python
df['date'] = pd.to_datetime(df['date'], infer_datetime_format=True, errors='coerce')
df['date'].dt.strftime('%Y-%m-%d') # Uniform output
For phones, addresses, use regex:
Python
import re
df['phone'] = df['phone'].str.replace(r'\D', '', regex=True) # Remove non-digits
Libraries like phonenumbers or usaddress parse and validate. Standardization enables reliable joins and groupings.
Inaccuracies violate logic rules; outliers are statistical deviants.
Apply validation rules:
Python
df = df[(df['age'] > 0) & (df['age'] < 120)]
df['email'].str.contains('@', regex=False) # Flag invalid
Outlier detection:
Visualization: matplotlib boxplots or seaborn violin plots.
Treatment: Remove if errors, cap (winsorize) for robustness, or flag for review. Domain knowledge is key—stock crashes are valid outliers.
Enrichment adds value: Geocode addresses via APIs (e.g., Google Maps) for location analytics. Merge with public datasets for demographics or weather.
Use cautiously to avoid introducing new errors or privacy risks.
Final validation: Run profiling, reject no keys.
Assertions are automated by such tools as pandas-profiling or Great Expectations.
Recordings in Jupyter notebooks, Markdown journals, or executed scripts are required in such collaboration and audits by the team.

The use of best practices in data scrubbing makes the process efficient, reproducible, and reliable. Such rules assist the novice in preventing typical errors as they climb up to the complicated projects.
In bigger or more complicated data sets, the sophisticated methods extend past the simple rules with the help of algorithms to provide an intelligent cleaning method.
Data scrubbing is viewed as having serious barriers, yet it can be solved through tactical measures.
These can only be addressed with initial planning: determine the size of the dataset to work with/privacy requirements, tool costs, and scripts to be rewritten. Challenges can be overcome with the right tools and mindset that will provide high-quality data with efficiency.
Also read: What are the 4 Stages of Money Laundering?
Learning how to do what it is data scrubbing will enhance superior decision-making. With this guide, which involves such definitions as data scrubbing definition and data cleansing definition, data cleaning problem discovery, data cleaning steps, and data cleaning tools such as Data Cleaning Software and Data Scrubbing Software, beginners will be able to clean data properly.
Get your feet wet: Use Kaggle sample data. The regular data scrubbing transforms the raw data into an asset. Reliable analytics, AI, and business intelligence are based on clean data.
Ixsight offers advanced Deduplication Software for precise data management. Explore our Sanctions Screening Software and AML Software for essential compliance and risk management. Additionally, our Data Scrubbing Software and Data Cleaning Software improve data quality, solidifying Ixsight's role as a leader in the financial compliance industry.
Our team is ready to help you 24×7. Get in touch with us now!